ISPARK: Fire station analytics
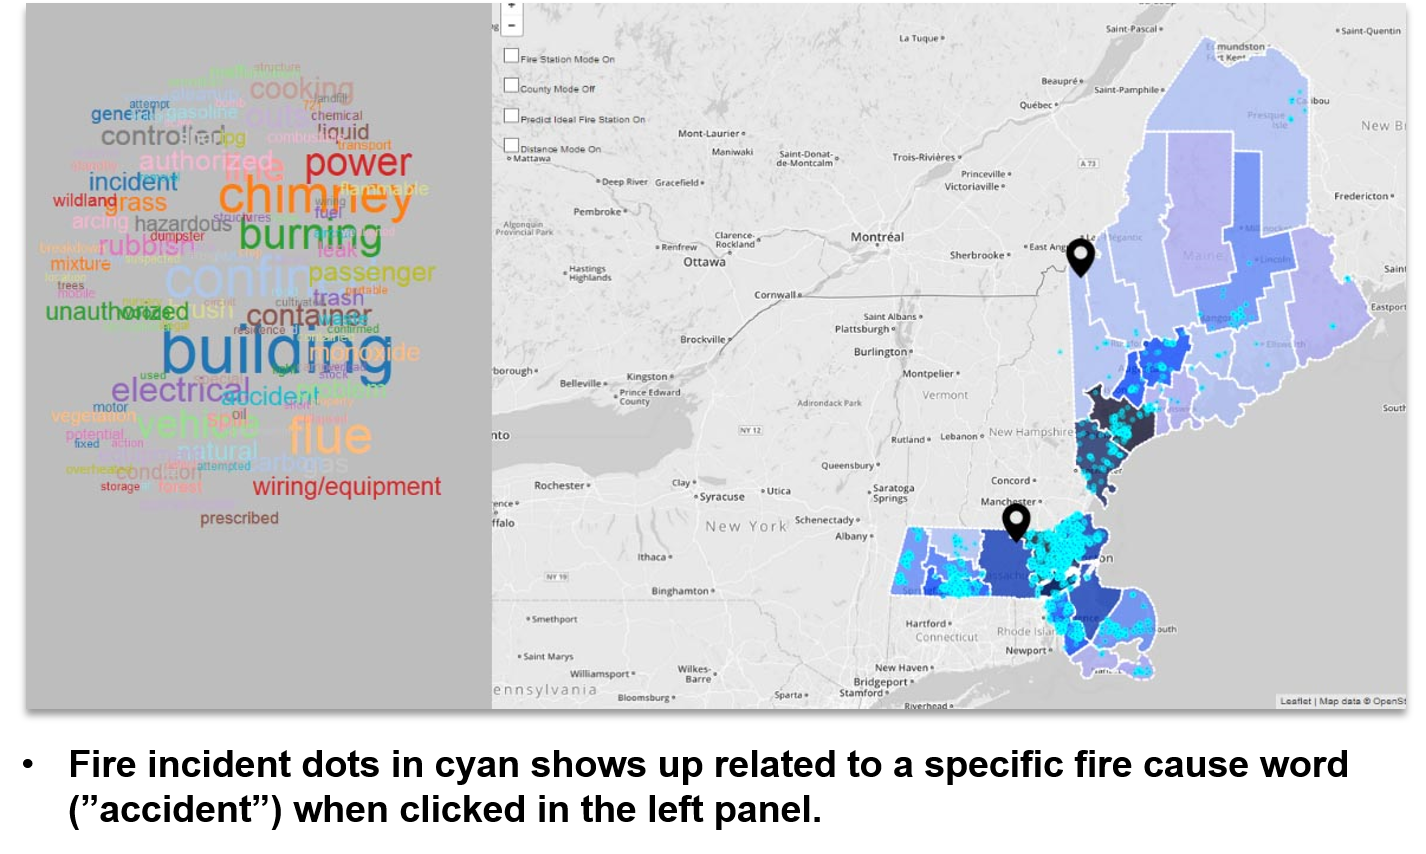
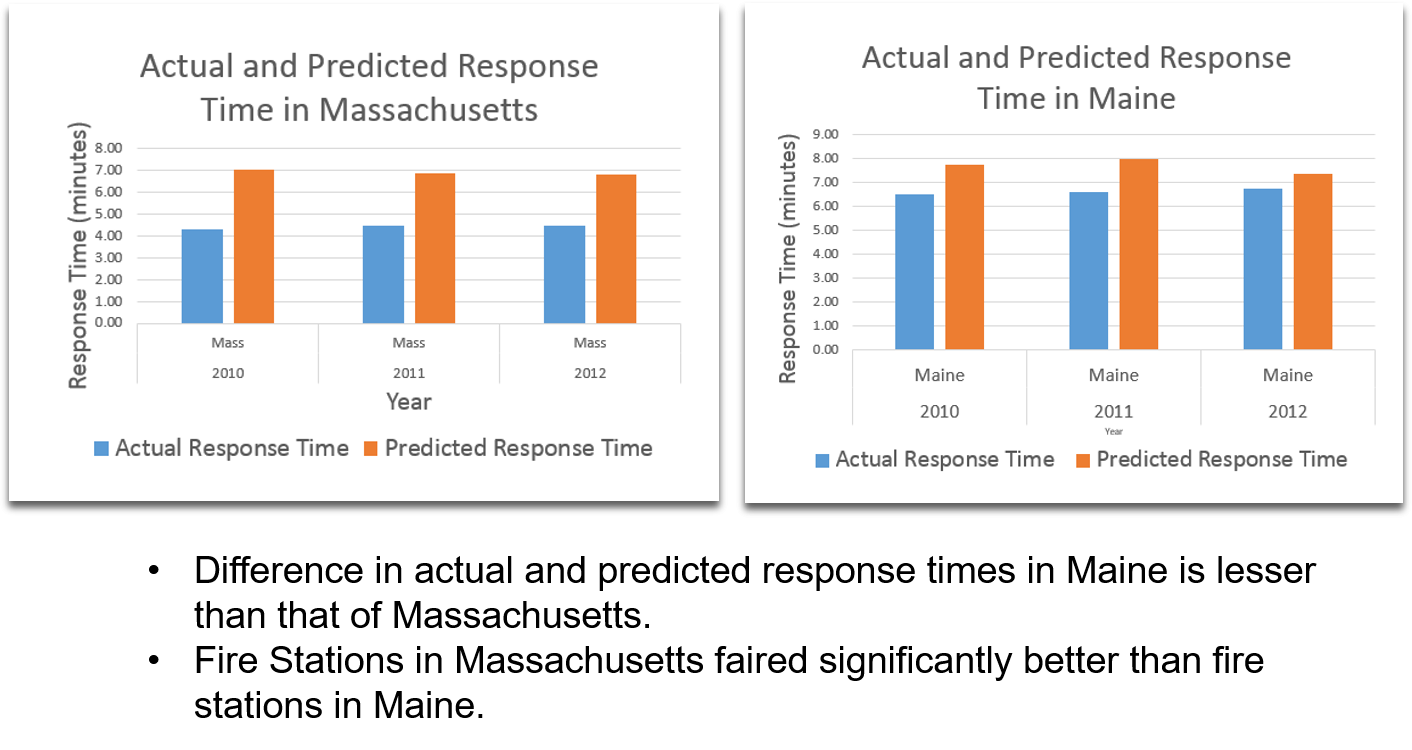
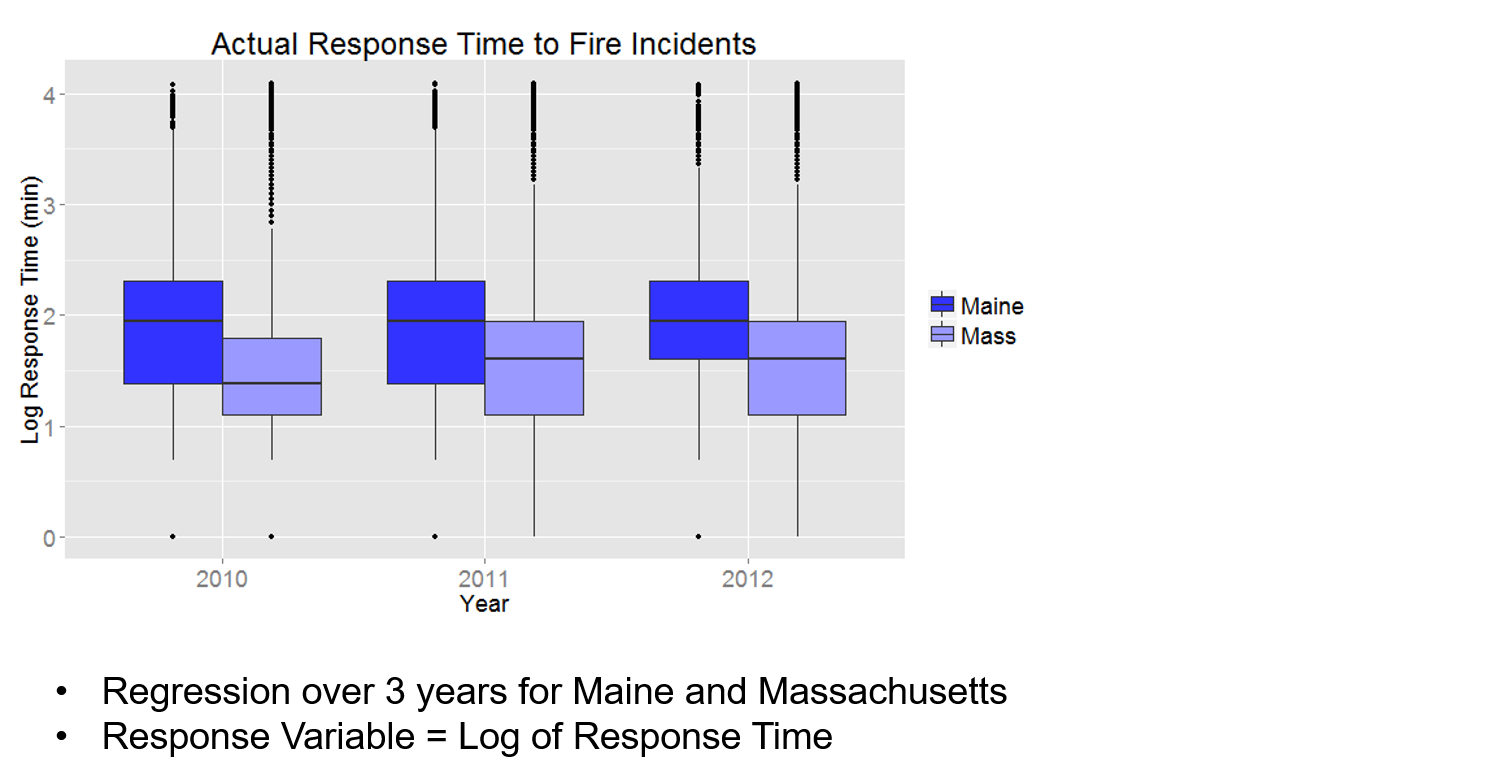
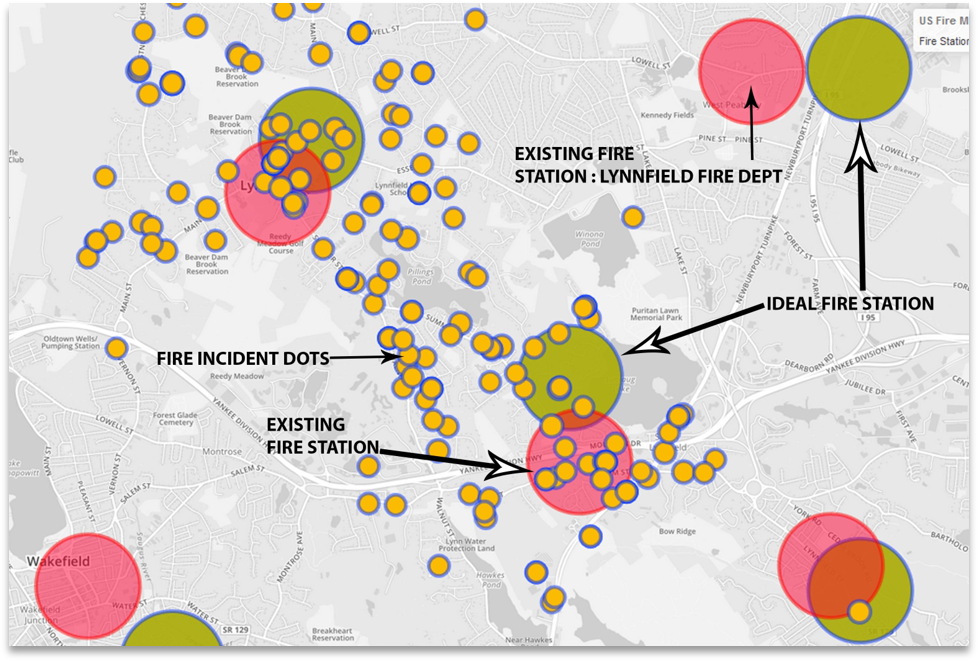
In support of helping to reduce the response time of fire- fighters, and thus deaths, injuries, and property loss due to fires, we introduce ISPARK. The ISPARK system deter- mines where fire stations should be located, analyzes the primary causes of fires, the existing infrastructure, and re- sponse times, by using visualizations which show the GIS mapping of fire stations on a dashboard. Incidents and re- sponse times are shown as additional layers, with cluster- ing of fire incidents to determine predicted fire station loca- tions, forecasting of fire incidents using regression, causal, infrastructure, and personnel analysis, creating an interac- tive, multi-faceted method for locating fire stations. A com- parison of urban and rural fire incident response times is an- other dimension of this study. We demonstrate ISPARK’s usage and benefits using a publicly available dataset describ- ing 300,000 fire incidents in the states of Massachusetts and Maine. ISPARK is generalizable to other geographic areas and domains, such as police stations, schools, hospitals.