
- Application: Geospatial tool evaluating job location mismatch PDF |
- Authors: Subhajit Das, F. Dutt
Geo-vis for job location mismatch
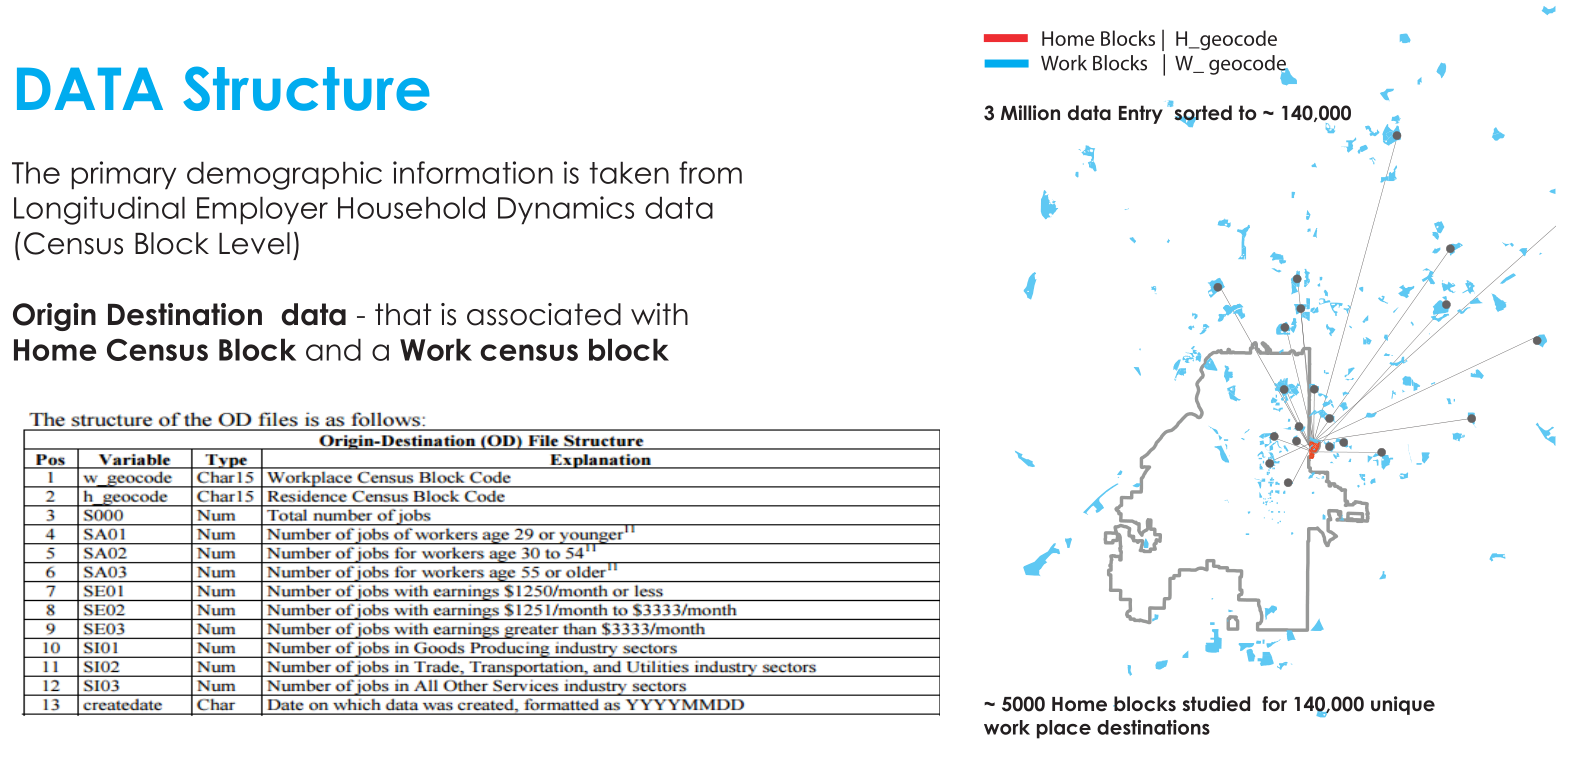
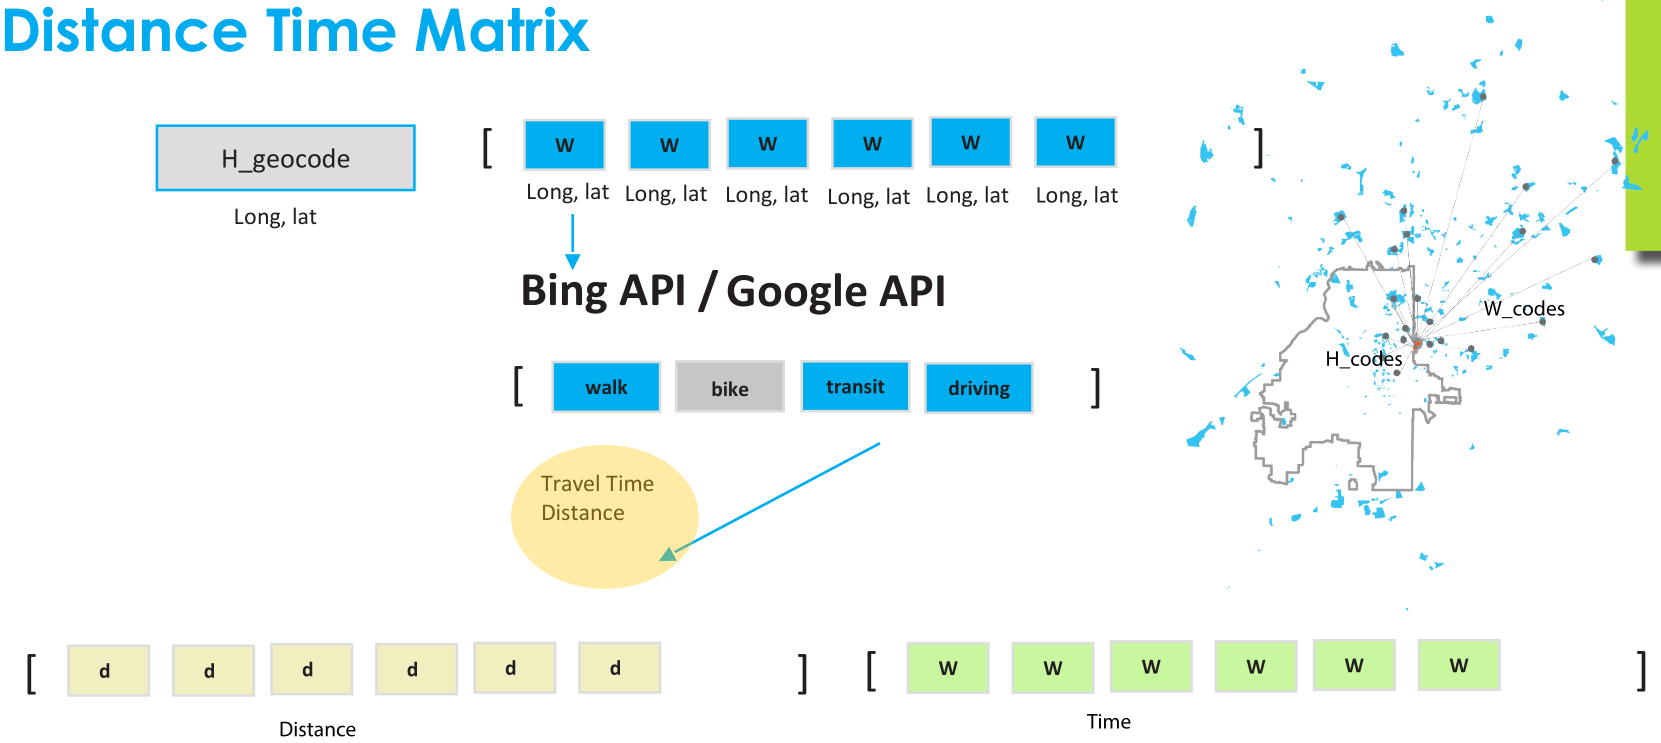
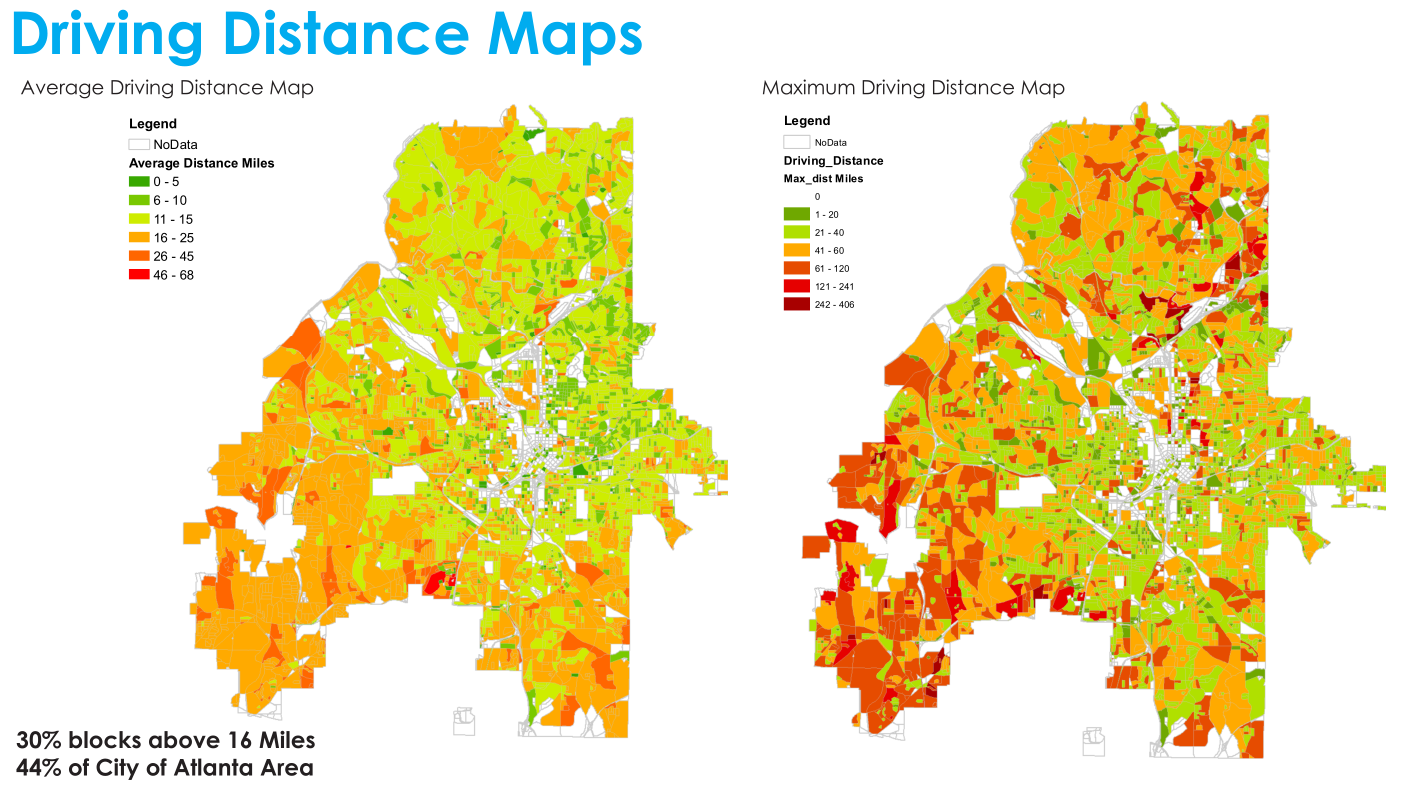
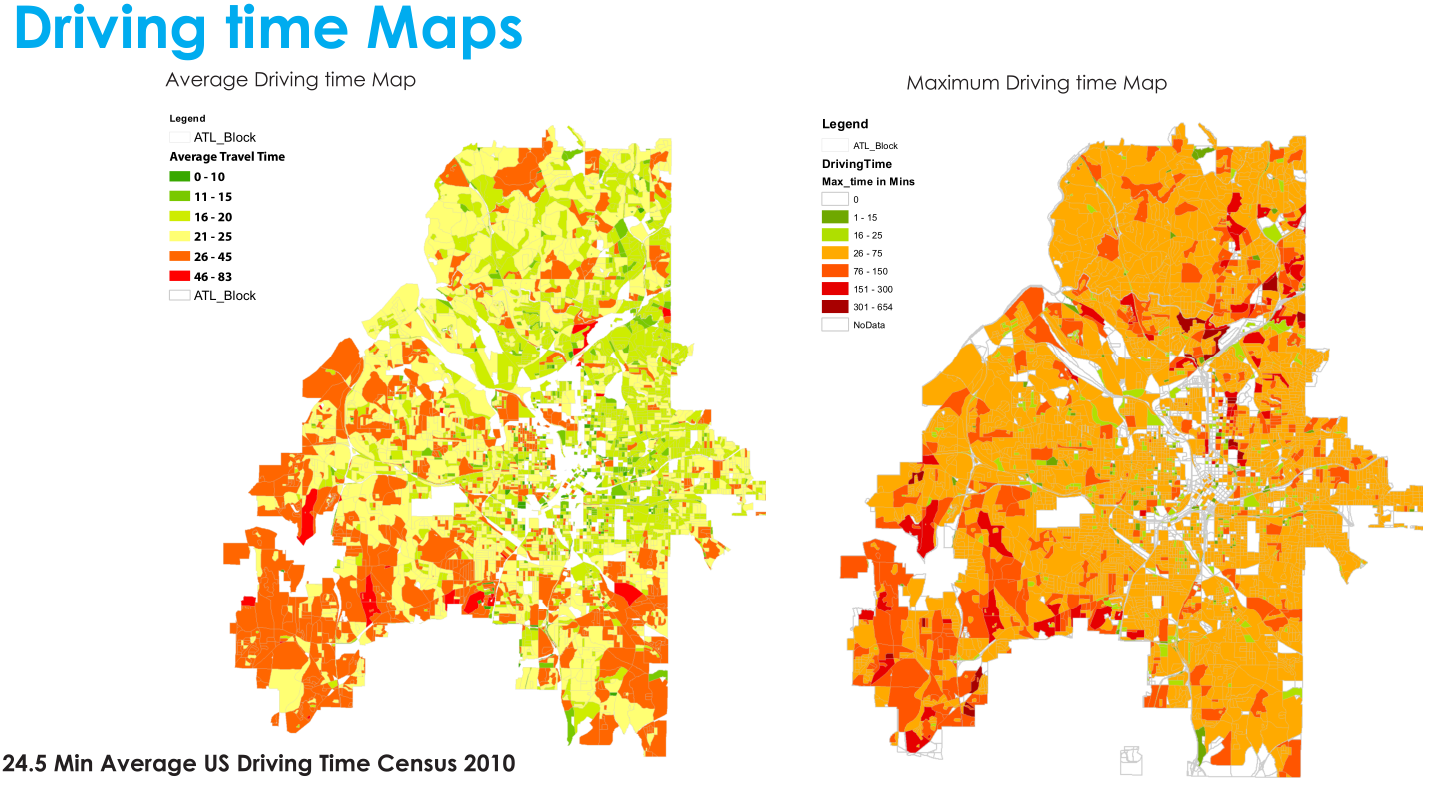
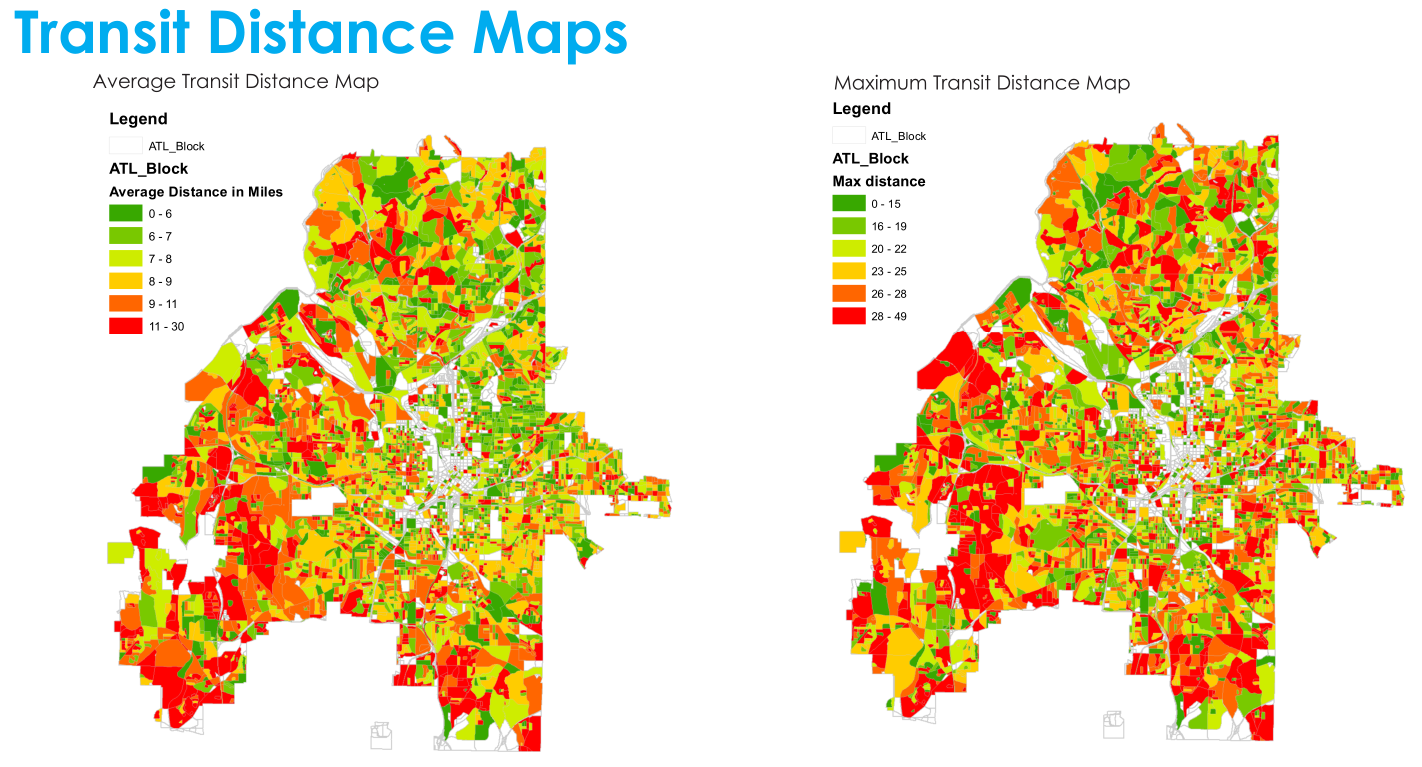
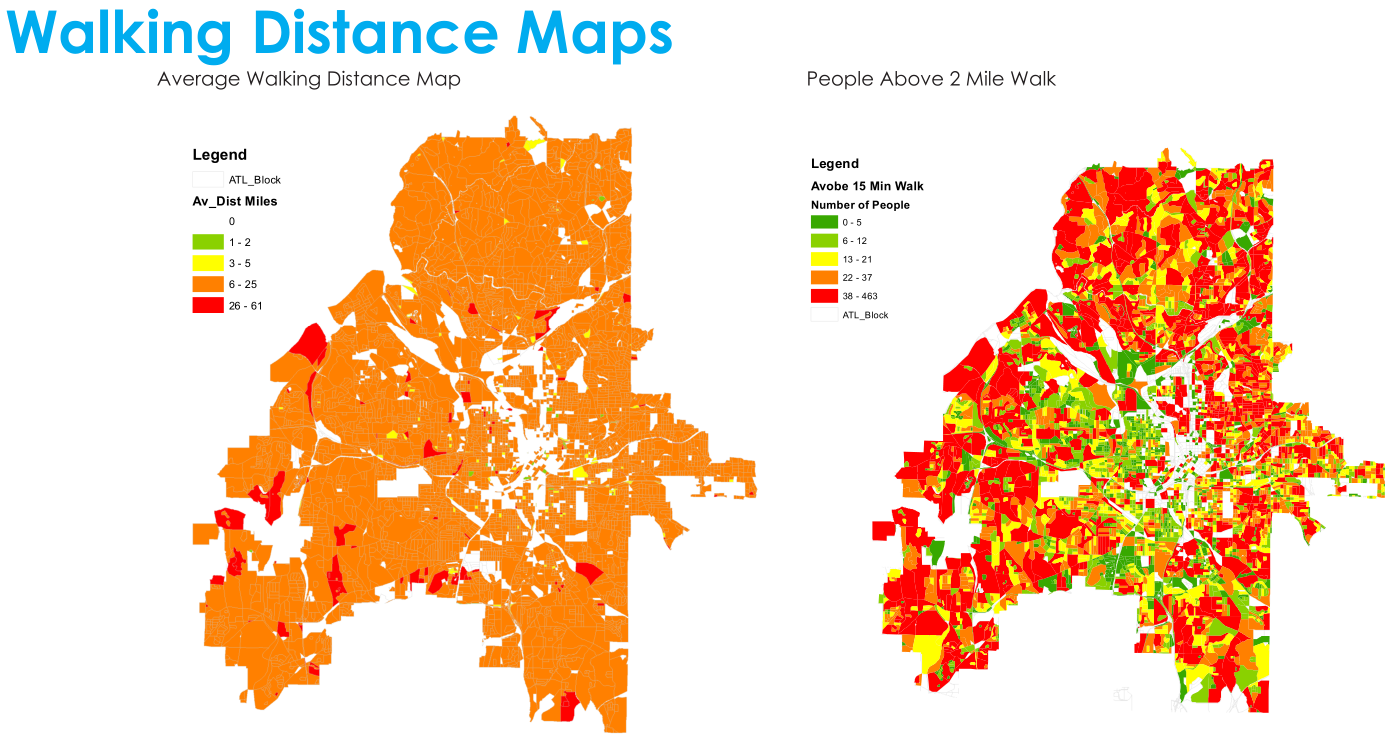
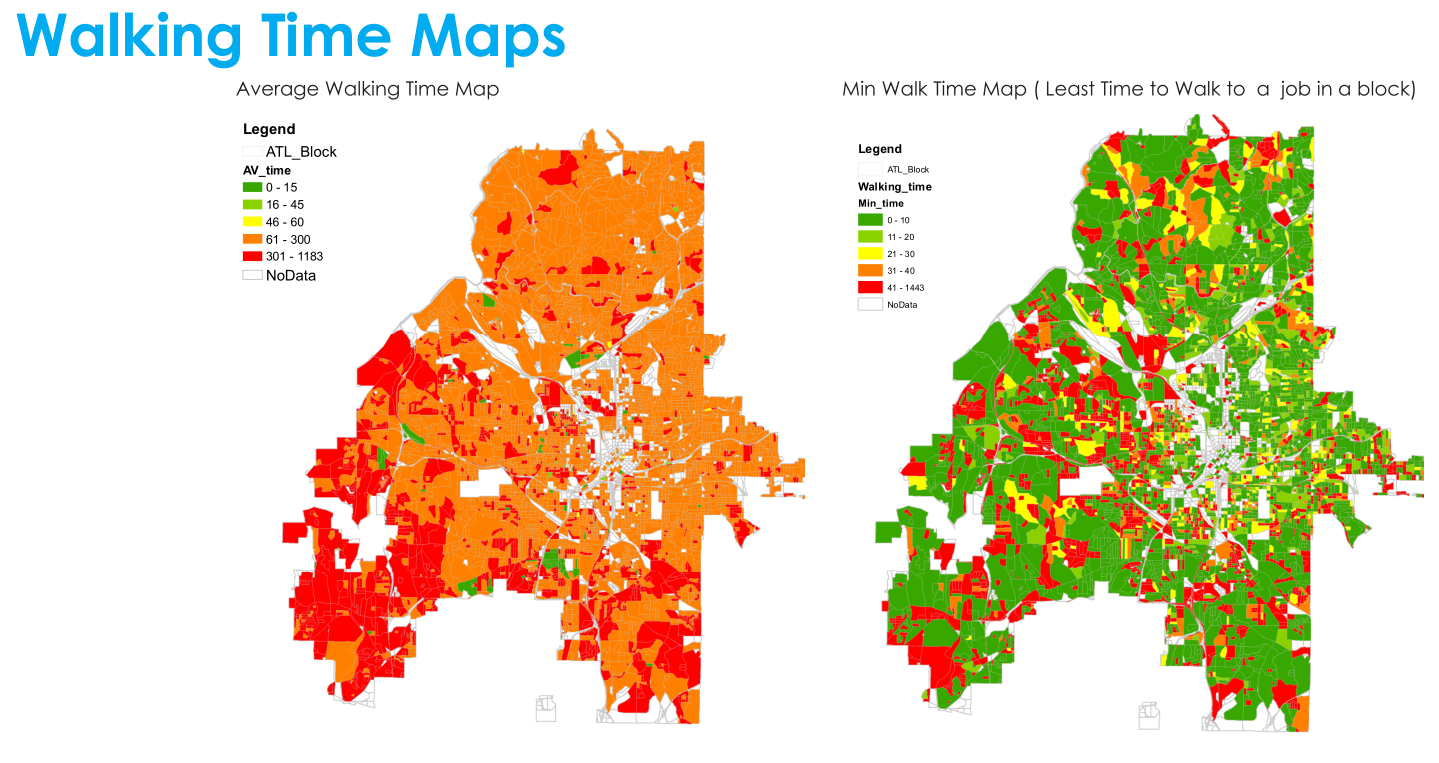
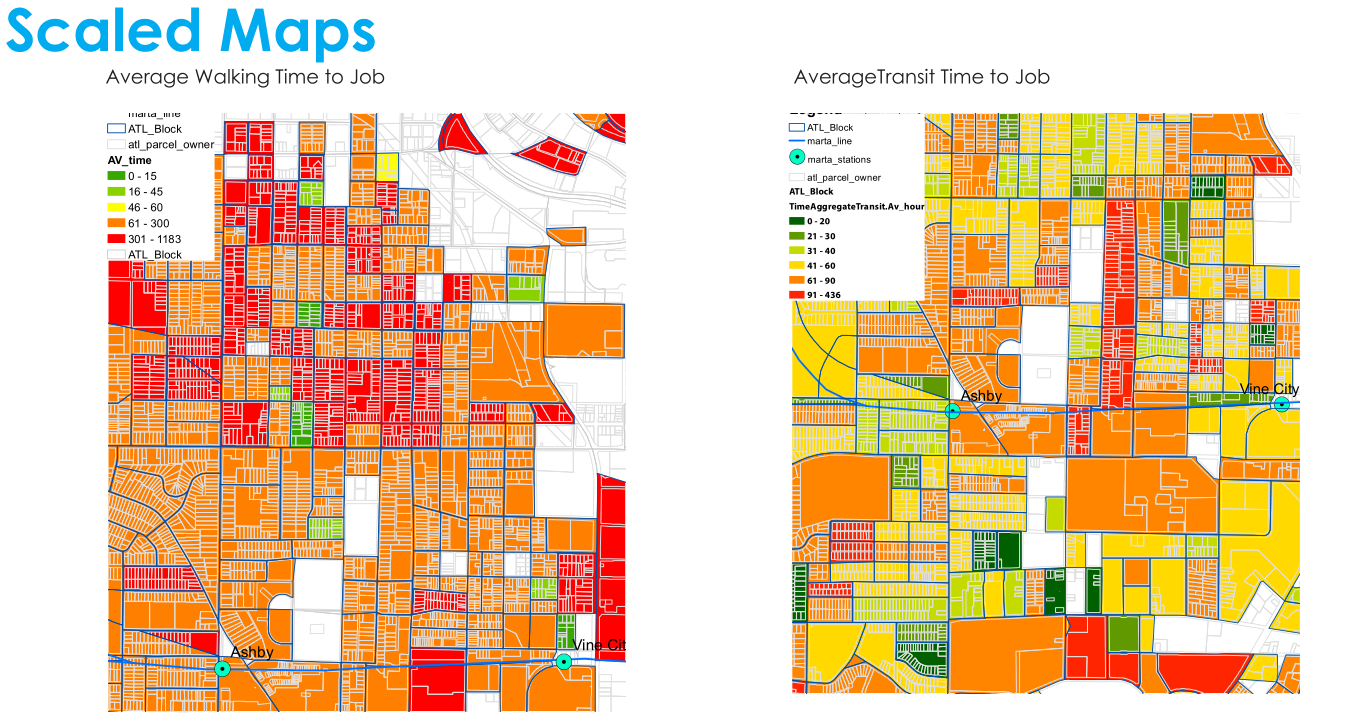
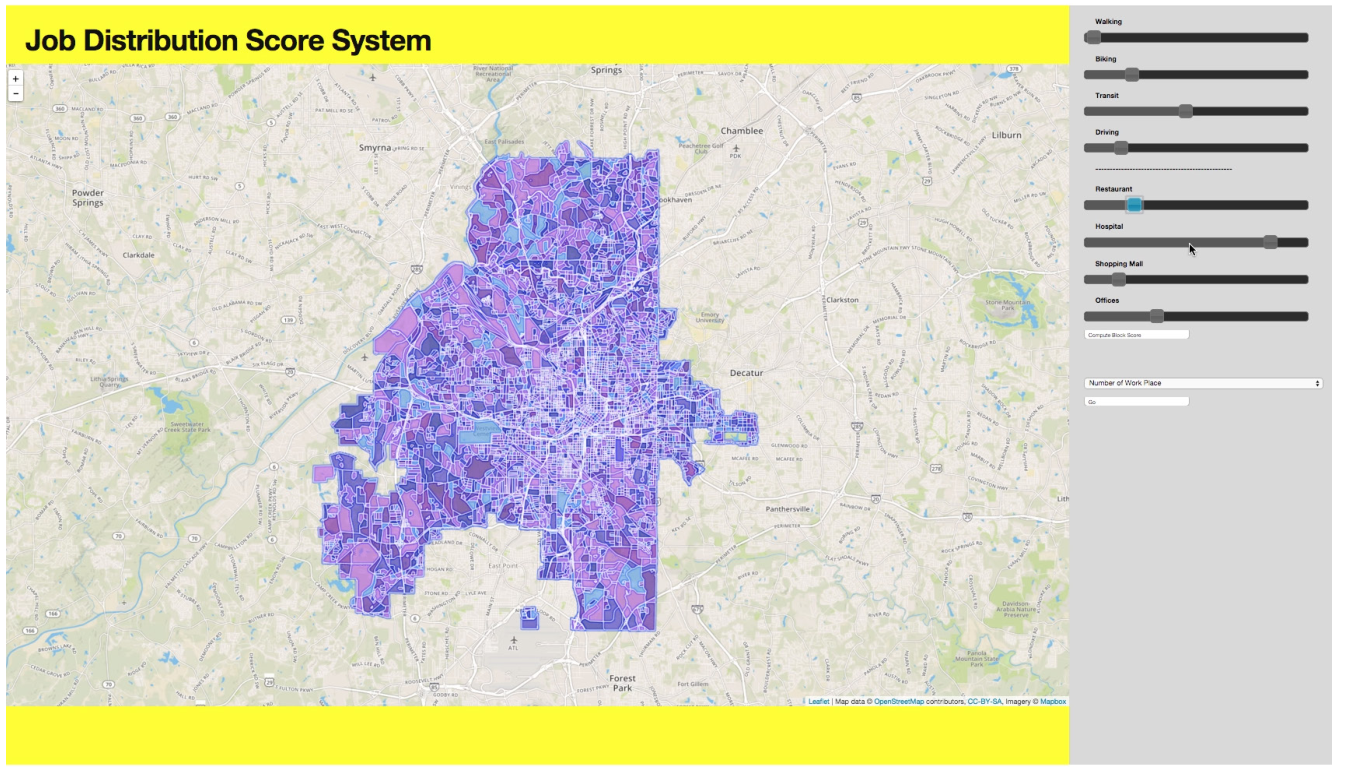
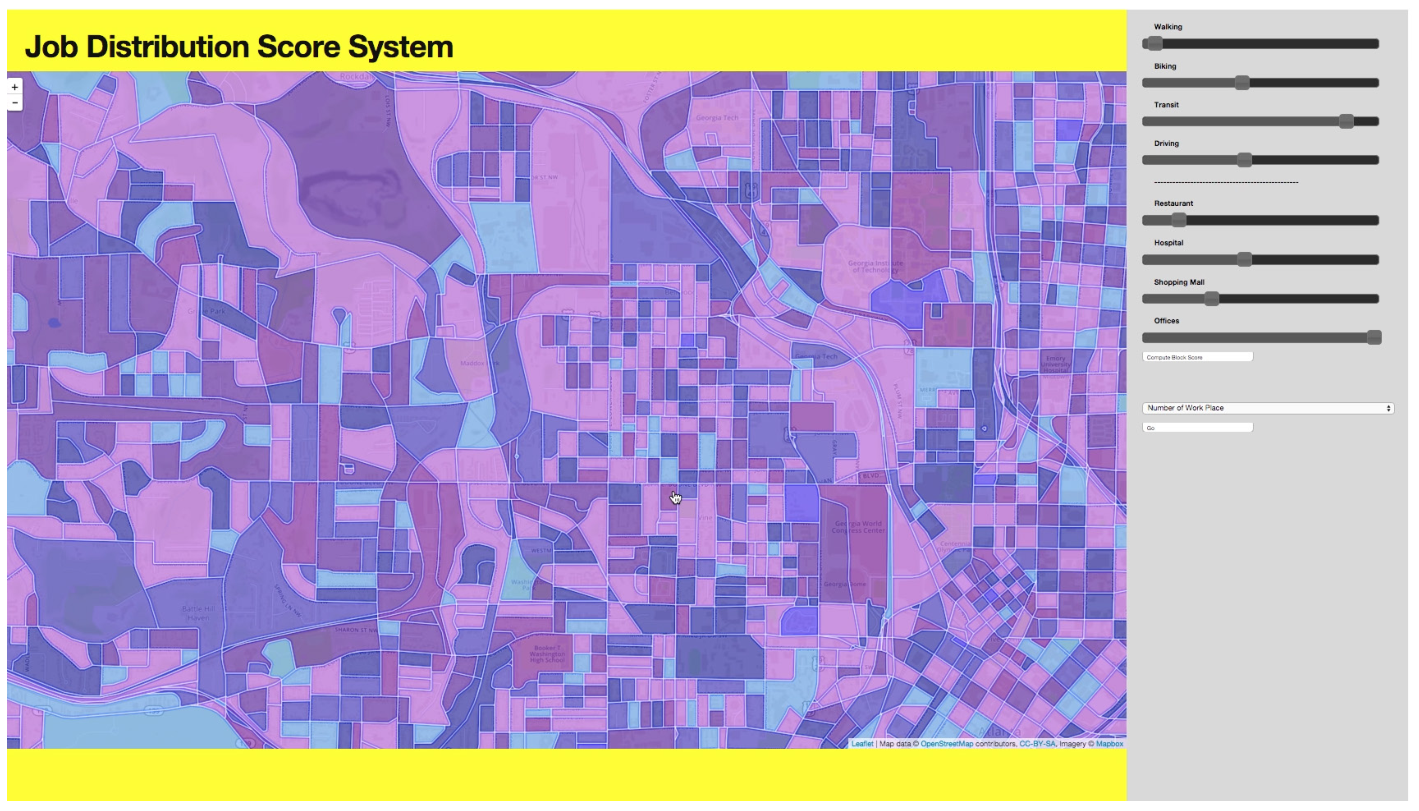
The paper addresses the issue of spatial mismatch of jobs and the accessibility to job locations based on different age, income and industry group. Taking Atlanta as a case study, we developed a geospatial analysis tool enabling developers, the city planning bureau and the residents to identify potential sites of redevelopment with better economic development opportunities along with finding potential location to live with respect to user’s choices for transit options, walkability, job location and proximity to chosen land use. We built our model on a block level in the city, imparting them a score, to visualize the data as a heat map. The metrics to compute the score included proximity to job, proximity to workers residence, transit availability, walkability and number of landmark elements near the site. We worked with LEHD Data along with RAC and WAC data sets, where the total number of data-points was over 3 million and thus one of the major challenges was to optimize computation such that the prototype conducts statistical analysis and updates visualization in real time. First, we develop a data matrix of home geocode id’s storing the related work geocode id’s longitude-latitude information using Python and MS Access, forming a one to many relationships in the origin-destination data set. Owing to the size of the data set and the need to join multiple tables we pre-sorted the tables using inbuilt optimized functions from R studio’s relevant packages. The distance matrix created is fed to Bing’s Route Data API on which we queried over 70000 times per day. It returned the duration, and the distance from the source to destination,sub-filtered with respect to biking, walking, transit and driving. Two key data fields were distance and travel time from each block to job locations, normalized by the number of jobs per block. Additionally, input threshold distance and threshold times are used to identify how many numbers of jobs are above certain distance threshold or travel time threshold. Resulting maps included thematic maps of various parameters derived from the above analysis. Further, we weighted the results based on user priorities, then used several geospatial spatial analyst tools for buffering, reclassification of land use, simple kriging, and hotspot analysis producing heat maps of various user inputs. Finally, we evaluated and ranked geographic locations (block groups) based on job suitability, accessibility, and consideration for future redevelopment. We also developed a prototype of a web application leveraging Leaflet’s Open Street Maps API and D3 visualization plugin. Our prototype showed that there is a high degree of spatial mismatch between home and job locations with very few jobs with driving distance within 5 -10 miles with limited transit options in Atlanta. Further showed that low-earning workers need to travel significantly larger distance for work compared to higher class. On the whole, the tool developed can inform various public and city development policies which is currently overlooked by way too much reliance on the census as the only source of data.